Prometheus란?
- 오픈소스 기반의 모니터링, 메트릭(지표) 수집 및 알람 시스템
- 쿠버네티스 클러스터, 파드, 서비스, 노드 등의 리소스 사용량, 상태 등 모든 메트릭을 실시간으로 수집·저장
Loki-Stack이란?
- 컨테이너 환경에 특화된 로그 수집/조회 시스템
Grafana란?
- 오픈소스 기반의 데이터 시각화 및 모니터링 도구로, 여러 데이터 소스에서 자동으로 데이터를 가져와 사용자가 원하는 대시보드를 구성하고 시각화할 수 있게 해준다.

쿠버네티스를 사용하면 모니터링툴을 통해 메트릭(성능 정보)과 로그(이벤트/에러)를 자동 수집,시각화 하여 운영을 투명하고 쉽게 만든다.
실습 과정
1. Github(k8s-1pro)에서 Prometheus(with Grafana), Loki-Stack yaml 다운로드
[root@k8s-master ~]# yum -y install git

# 로컬 저장소 생성
git init monitoring
git config --global init.defaultBranch main
cd monitoring

# remote 추가 ([root@k8s-master monitoring]#)
git remote add -f origin https://github.com/k8s-1pro/install.git

# sparse checkout 설정
git config core.sparseCheckout true
echo "ground/k8s-1.27/prometheus-2.44.0" >> .git/info/sparse-checkout
echo "ground/k8s-1.27/loki-stack-2.6.1" >> .git/info/sparse-checkout

# 다운로드
git pull origin main
2. Prometheus(with Grafana) 설치
# 설치 ([root@k8s-master monitoring]#)
kubectl apply --server-side -f ground/k8s-1.27/prometheus-2.44.0/manifests/setup
kubectl wait --for condition=Established --all CustomResourceDefinition --namespace=monitoring
kubectl apply -f ground/k8s-1.27/prometheus-2.44.0/manifests

# 설치 확인 ([root@k8s-master]#)
kubectl get pods -n monitoring
3. Loki-Stack 설치
# 설치 ([root@k8s-master monitoring]#)
kubectl apply -f ground/k8s-1.27/loki-stack-2.6.1

# 설치 확인
kubectl get pods -n loki-stack
4. Grafana 접속

URL : http://192.168.56.30:30001
username : admin
Password : admin
5. Grafana에서 Loki-Stack 연결
Connect data에서 "loki"검색 후 항목 클릭.
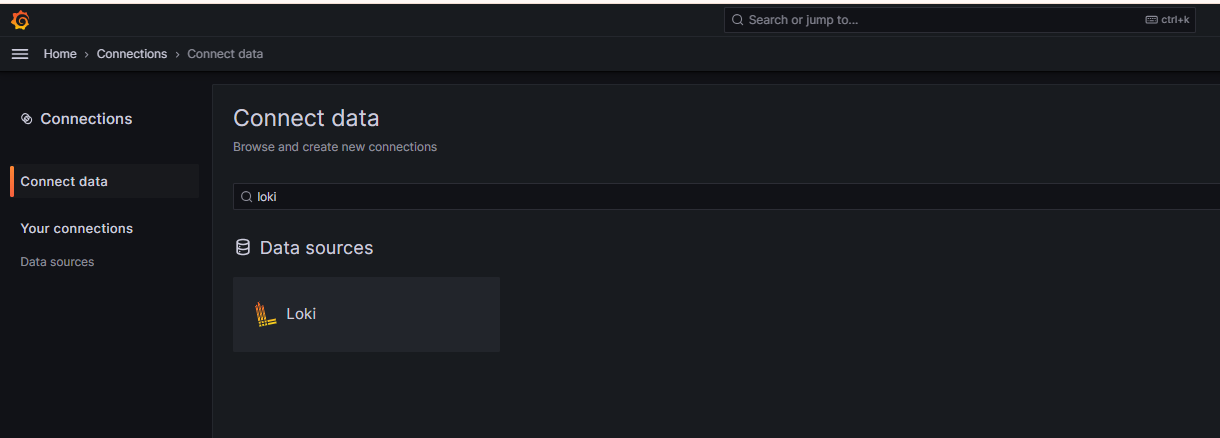

URL에 http://loki-stack.loki-stack:3100 입력하고 하단에 Save & Test 클릭
6. App 배포 환경 구성하기
쿠버네티스 대시보드에 접속하여 YAML 파일을 업로드
apiVersion: apps/v1
kind: Deployment
metadata:
  name: app-1-2-2-1
spec:
  selector:
    matchLabels:
      app: '1.2.2.1'
  replicas: 2
  strategy:
    type: RollingUpdate
  template:
    metadata:
      labels:
        app: '1.2.2.1'
    spec:
      containers:
        - name: app-1-2-2-1
          image: 1pro/app
          imagePullPolicy: Always
          ports:
            - name: http
              containerPort: 8080
          startupProbe:
            httpGet:
              path: "/ready"
              port: http
            failureThreshold: 20
          livenessProbe:
            httpGet:
              path: "/ready"
              port: http
          readinessProbe:
            httpGet:
              path: "/ready"
              port: http
          resources:
            requests:
              memory: "100Mi"
              cpu: "100m"
            limits:
              memory: "200Mi"
              cpu: "200m"
---
apiVersion: v1
kind: Service
metadata:
  name: app-1-2-2-1
spec:
  selector:
    app: '1.2.2.1'
  ports:
    - port: 8080
      targetPort: 8080
      nodePort: 31221
  type: NodePort
---
apiVersion: autoscaling/v2
kind: HorizontalPodAutoscaler
metadata:
  name: app-1-2-2-1
spec:
  scaleTargetRef:
    apiVersion: apps/v1
    kind: Deployment
    name: app-1-2-2-1
  minReplicas: 2
  maxReplicas: 4
  metrics:
    - type: Resource
      resource:
        name: cpu
        target:
          type: Utilization
          averageUtilization: 40
쿠버네티스 대표기능 테스트
쿠버네티스의 대표기능으로는 Traffic Routing, Self-Healing, AutoScaling, RollingUpdate가 있다.
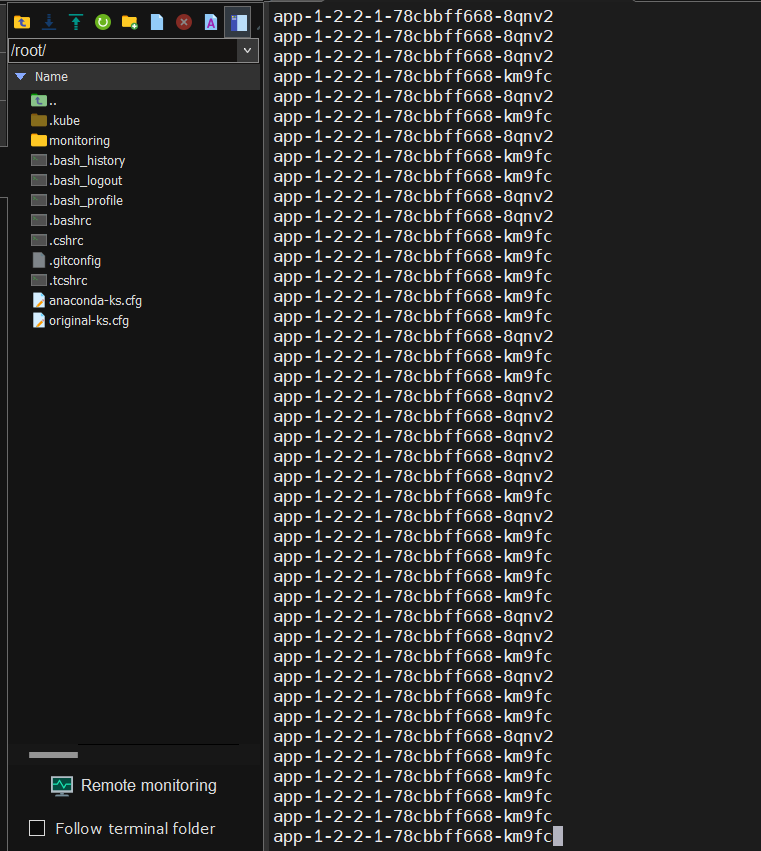
- Traffic Routing(로드 밸런싱) : 쿠버네티스는 클러스터 내부 및 외부의 트래픽을 효과적으로 제어할 수 있는 다양한 트래픽 라우팅 메커니즘을 제공한다.
[root@k8s-master ~]# while true; do curl http://192.168.56.30:31221/hostname; sleep 2; echo ''; done;위 명령어를 통해 App에 트래픽을 지속적으로 보내면 트래픽을 여러 파드로 분산시키고 있는것을 확인할 수 있다.
이는 쿠버네티스 서비스가 파드들 사이로 로드 밸런싱을 수행하기 때문에 일어나는 현상이다.
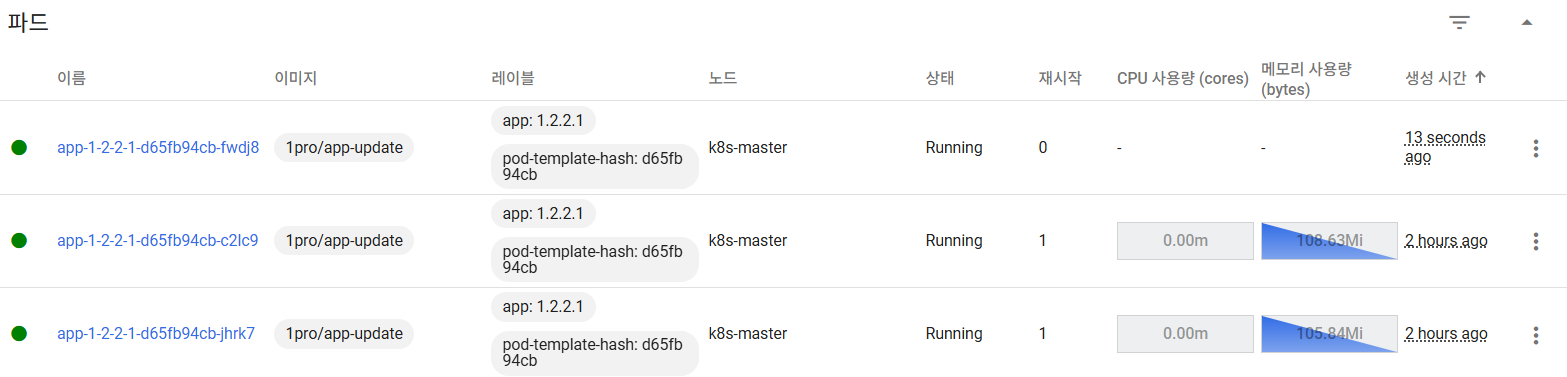
- Self-Healing(자가복구) : 시스템의 가용성과 안정성을 자동으로 유지시켜준다.
[root@k8s-master ~]# curl 192.168.56.30:31221/memory-leak위 명령어는 인위적으로 메모리 누수(memory leak)가 발생하도록 트리거하는 명령어이다.
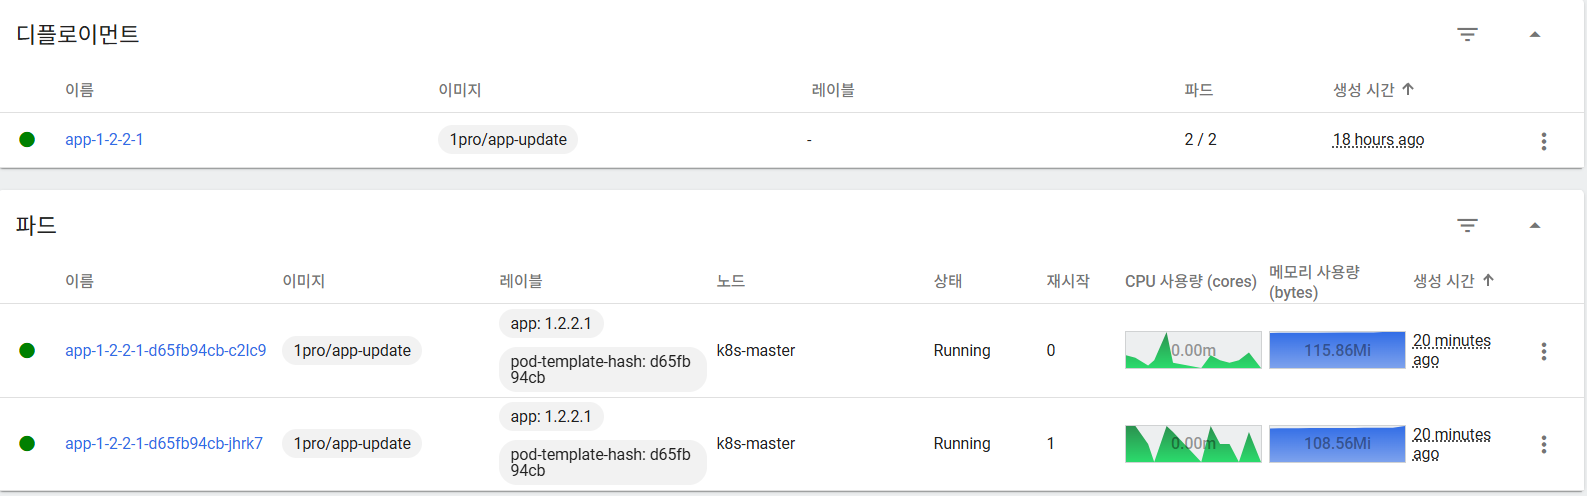
메모리 누수와 같은 오류가 발생할 경우 위 사진과 같이 파드를 자동으로 재시작하여 오류 상황에 대처한다.
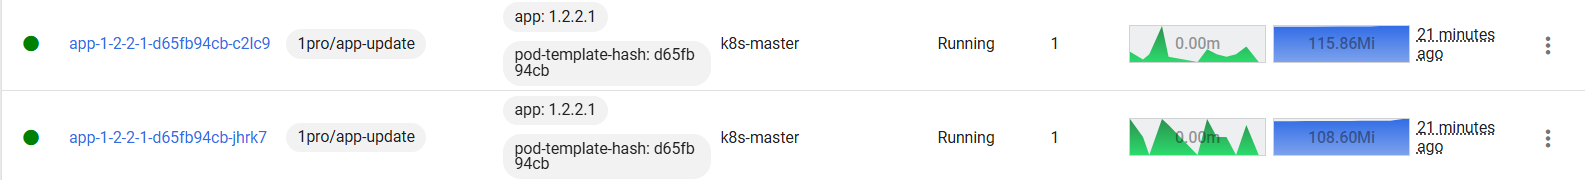
- AutoScaling : 애플리케이션 워크로드와 클러스터의 리소스 수요에 맞춰 파드와 노드를 자동으로 증감시키는 기능이다.
[root@k8s-master ~]# curl 192.168.56.30:31221/cpu-load위 명령어를 통해 App에 인위적으로 부하를 주면 기존의 파드로 부족하다고 판단이 되면 새로운 파드가 추가로 생성된다.
- Rolling Update : 무중단 배포를 위한 주요 기능으로, 기존 파드를 점진적으로 새로운 버전으로 교체하는 업데이트 전략이다.만약 문제가 발생할 경우 이전 버전으로 신속하게 롤백이 가능하여 대규모, 고가용성, 자동화된 클라우드 네이티브 환경에서 서비스 신뢰성과 운영 효율성을 크게 향상시키는 핵심 요소이다.
'DevOps > Kubernetes' 카테고리의 다른 글
| [Kubernetes] Jenkins를 활용한 Blue/Green 배포 구현 (3) | 2025.08.05 |
|---|---|
| [Kubernetes] 배포 전략(Recreate/ RollingUpdate / BlueGreen / Canary) (2) | 2025.08.04 |
| [kubernetes] Probe (2) | 2025.07.31 |
| [Kubernetes] 쿠버네티스 오브젝트 정리 (3) | 2025.07.30 |
| Kubernetes란?, Kubernetes 설치 (2) | 2025.07.29 |